Microsoft have introduced a new CopiIot in SharePoint capability for creating dynamic HTML dashboards. To try this out I decided to create a dashboard for managing the Controlled Documents System that I have built to demonstrate concepts and features of SharePoint, Power Automate and more.
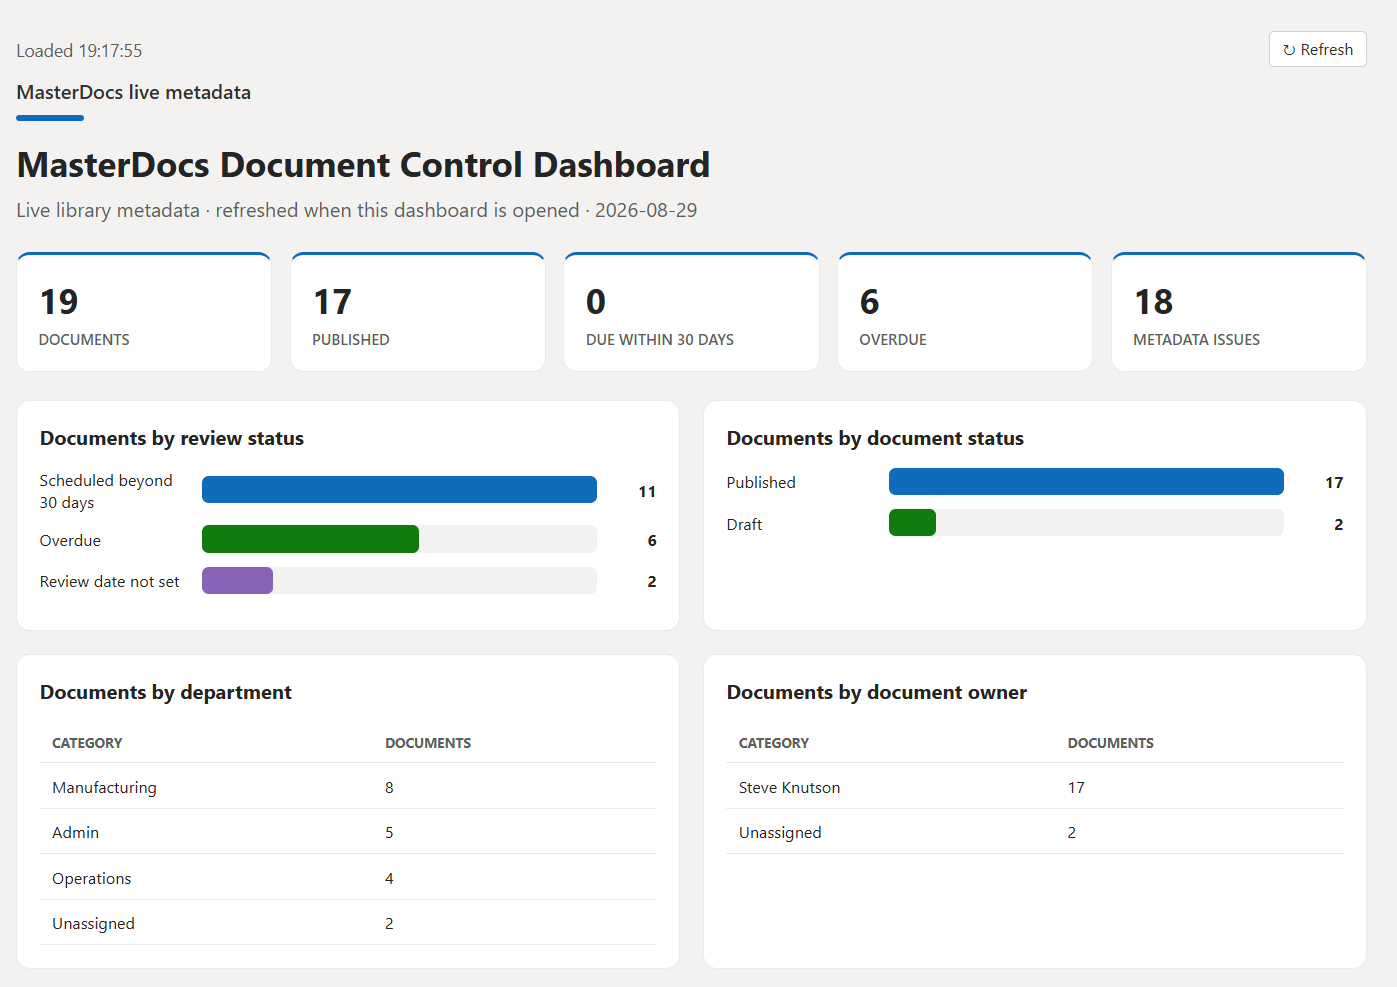
Document controllers find themselves chasing people across their organisation to ensure documents are up to date. Reviews need to be completed, approvals done and documents published. To track and manage this metadata is used to track key dates, statuses and responsibilities.
The person creating the dashboard must have a Microsoft 365 Copilot license. Anyone can view the dashboard, they don’t need a Copilot license (or Power BI).
How to create a Dashboard
Start with a Library or List configured with metadata and loaded with the content you want.
- Navigate to the Library or List
- Click the Copilot icon in SharePoint and open the Chat
- Create a prompt to generate the dashboard (see example prompt below)
- Preview the dashboard and make adjustments
- Open the dashboard, grab the URL from the browsers address bar and add it to a Quick Link (or another navigation element in your site)
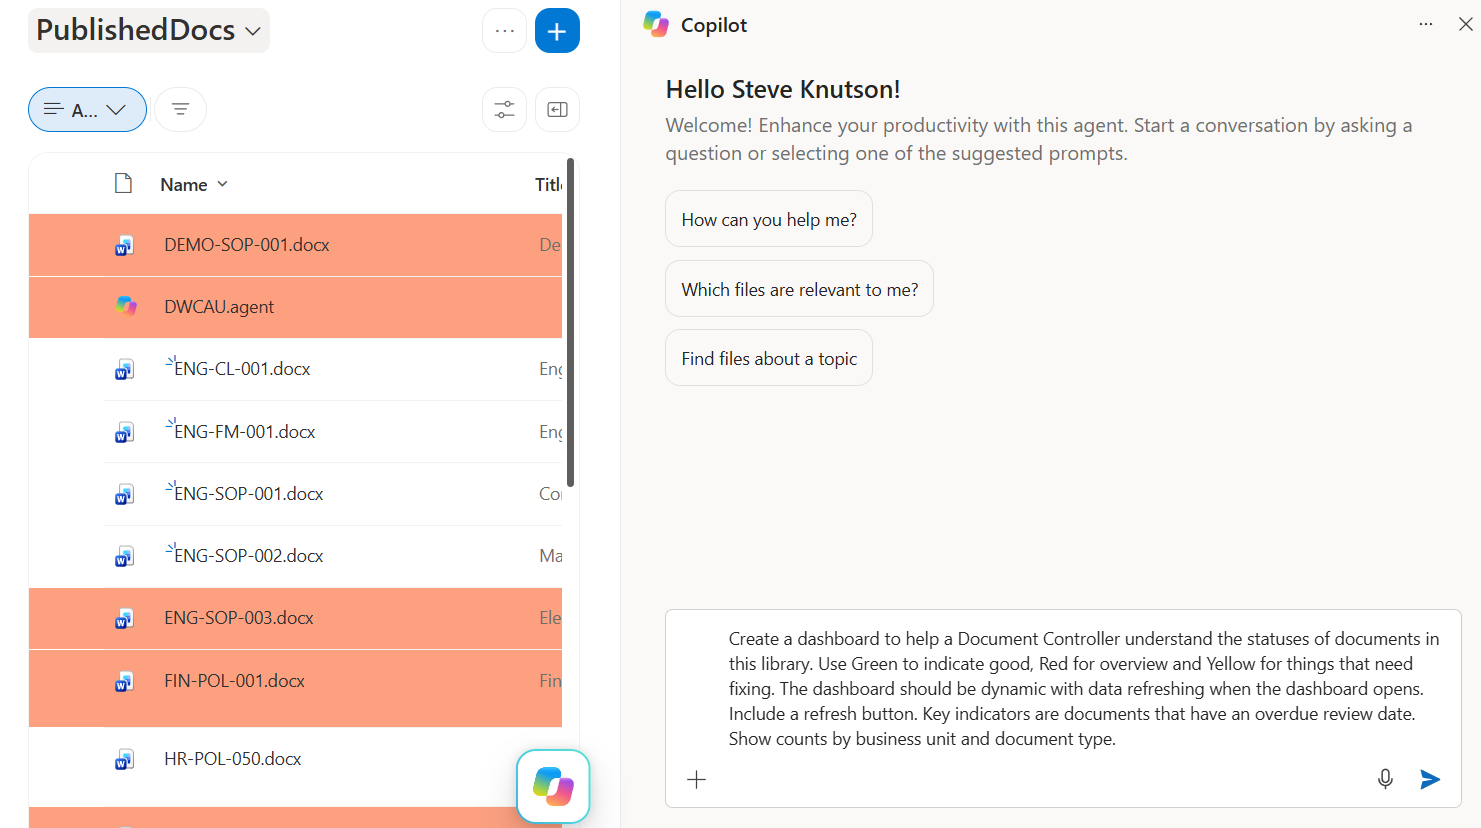
Sample Prompt from the screenshot:
Create a dashboard to help a Document Controller understand the statuses of documents in this library. Use Green to indicate good, Red for overview and Yellow for things that need fixing. The dashboard should be dynamic with data refreshing when the dashboard opens. Include a refresh button. Key indicators are documents that have an overdue review date. Show counts by business unit and document type.
The prompt creates a dashboard file in the document library, so you can control access via permissions if needed.
I have noticed that sometimes the dashboard will show a Javascript error or appear blank without data. To fix this follow up with a prompt explaining the issue e.g. “there is no data showing in the dashboard”. Copilot does usually fixes quickly.
Here is the finished dashboard created from the prompt above.
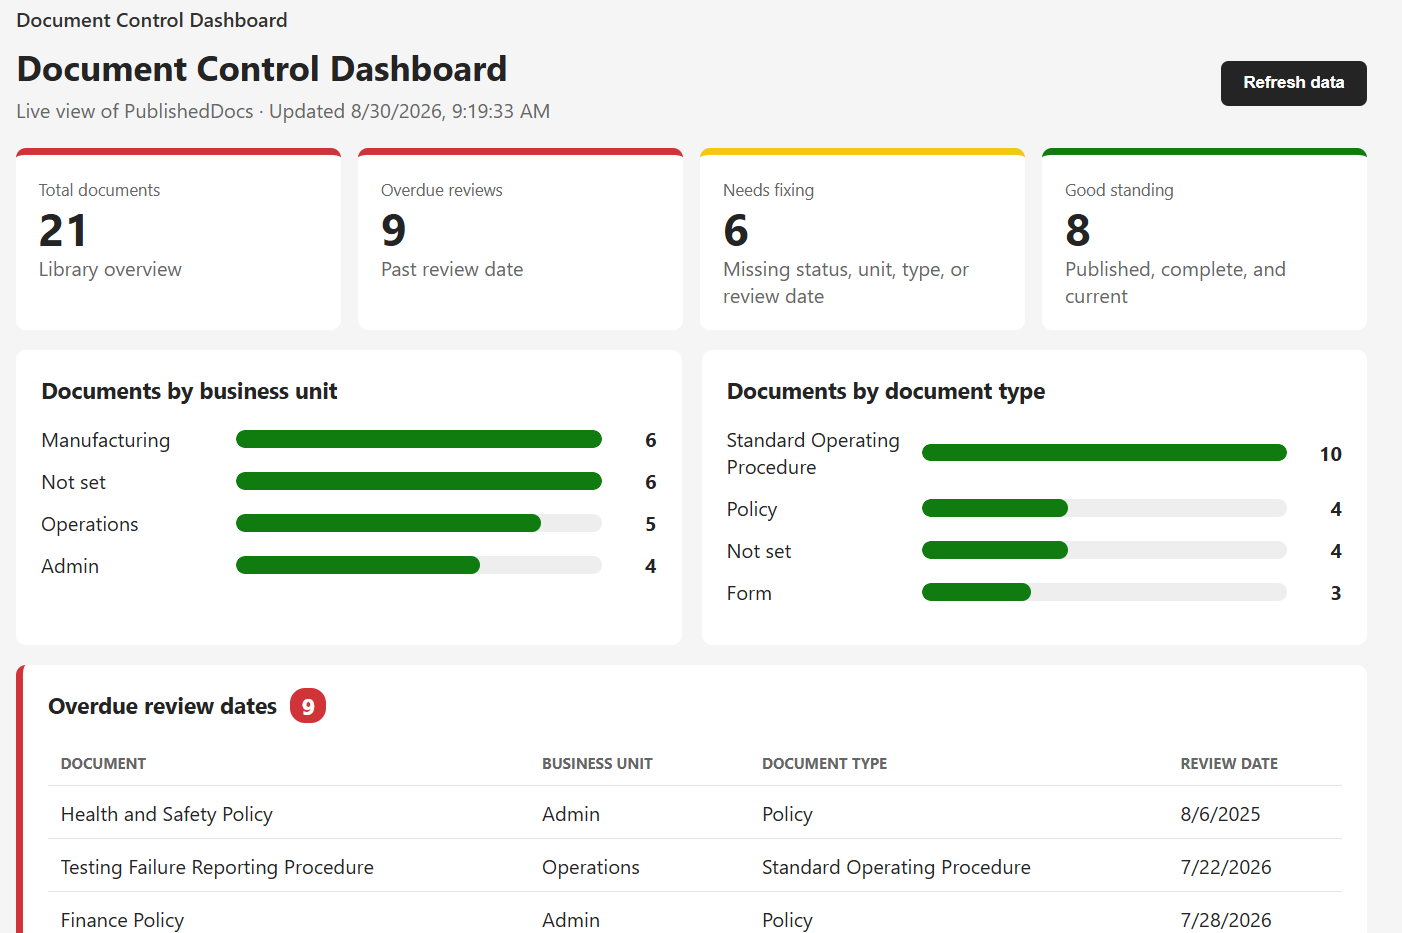
Another thing that I have noticed is the colours often don’t appear as you would like. You can ask Copilot to update the specific graph and tell it which colours to use for each status e.g. Green for Published, Yellow waiting for approval, Gray for draft etc.
You can also create a static snapshot if you want a point in time record. Perhaps you have a KPI to improve and want to provide evidence of the starting state and show improvement with another snapshot at review time.
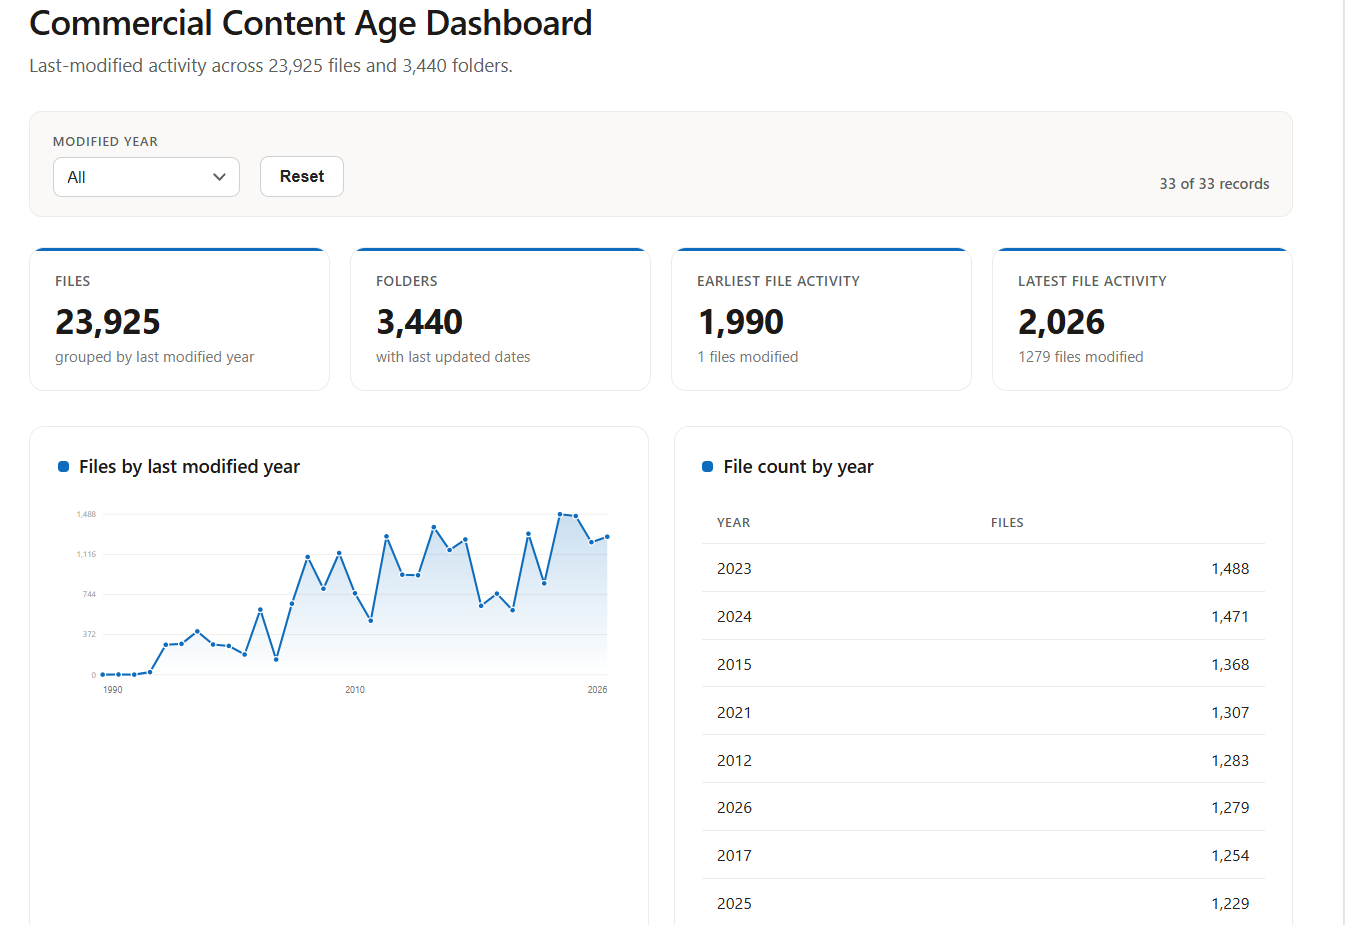
Does this work for bigger Document Libraries? Yes it does! Here is an example I did to check the age, distribution and growth of content in a document library with nearly 24,000 files. You can see the impact of the Covid Pandemic on the rate of content creation!
So there you have it. A really easy way to get insights into your content and create a dashboard that anyone can use. Visit my YouTube Channel to learn more about Controlled Document Systems with SharePoint and Power Automate.
Discover more from SharePoint Moments
Subscribe to get the latest posts sent to your email.
